
Intro
As a result of my pre-calculus class's understanding of periodic trigonometric functions, in this project, we used them to compare long-term average monthly temperatures to recorded monthly temperatures. In doing so, groups of three to four created a weather report video with a long-term forecast estimation using the understanding garnered from class.
Process
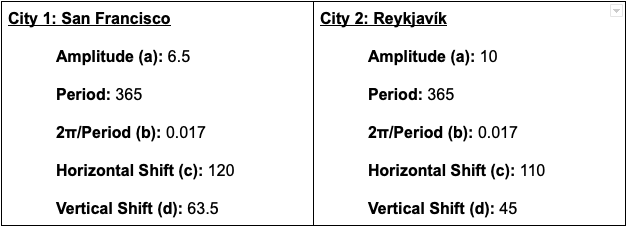
The first step in completing this project was to pick two cities in the world. Once we decided on these cities, we investigated and recorded the average monthly temperatures for a 12-‐month period. Our cities were San Fransisco, California, and Reykjavik, Iceland. Once this data was recorded, we graphed month the 12 points on average monthly temperature by day of the year with an online graphing software. Once this was completed, a line of best fit was formulated,


From this graphs we could calculate features of the functions.
Once all mathematical work was done my team and I took on the role of weather reporters. This role included developing a script and using editing technology to put together a weather report culminating all mathematical findings from the function of one our two cities.
